n8n
n8n Evaluations in 2026: Test AI Workflows Before They Break
n8n evaluations catch AI quality drift before your customers do. Which metrics to use, what each plan tier unlocks, and how to build a regression suite.
27 Aug 2026 · 9 min read · Abhijeet Singh
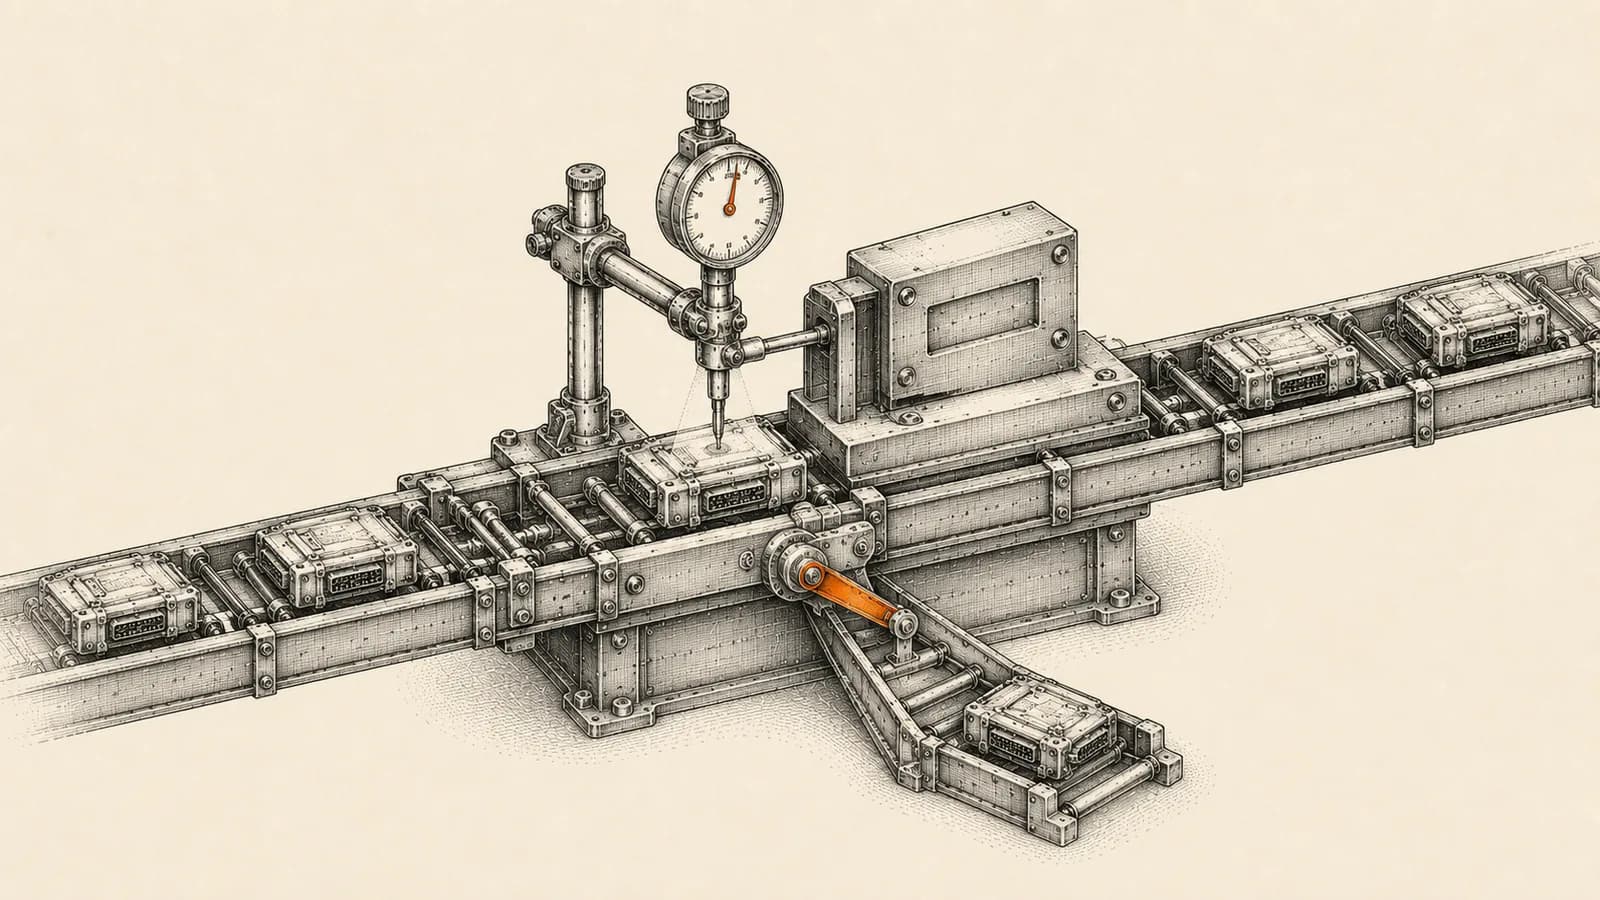
Most AI automation fails quietly. The workflow throws no error, the execution log stays green, and a classification that used to be right nine times out of ten is now right seven times out of ten because someone improved a prompt last Tuesday. n8n evaluations exist to catch exactly that class of failure, and if you are running any LLM step in production without them, you are shipping on hope. This guide covers what n8n evaluations do, which built-in metrics are worth using, what each plan tier unlocks, and how to grow ten test cases into a regression suite.
What n8n evaluations actually do
An evaluation runs a test dataset through your workflow, one row at a time, and records what came out. Each row holds a sample input, usually an expected output, and a blank column that the run fills in with the actual output.
n8n's documentation frames it plainly: code is deterministic and you can reason about it, but language models are black boxes, so you measure output by running data through them. Confidence comes only after running a range of inputs that reflect the edge cases production will throw at you.
Three pieces do the work. The Evaluation Trigger reads the dataset and emits one item per row, the Evaluation node writes results back and records scores, and the Evaluations tab is where you press Run Test and compare one run against the last.
The Evaluation node has exactly three operations, and knowing them is most of the learning curve. Set Outputs writes the workflow's actual output back into the dataset. Set Metrics records numeric scores that show up in the Evaluations tab. Check If Evaluating has no parameters at all and simply branches, so you can run scoring logic during a test and skip it during a real production execution.
That third operation matters more than it looks. AI-graded metrics cost tokens and add latency, so putting the metric logic behind a Check If Evaluating branch means your customers never pay for the grading step.
Light evaluation versus metric-based evaluation
n8n splits evaluation into two modes, and they belong at different points in a project.
Light evaluation is the pre-deployment mode. You hand-write a handful of examples, wire the trigger in, write outputs back, and eyeball the results side by side. Expected outputs and metrics are both optional. It happens in the Editor tab, and n8n's own guidance is that early on the effort of formal scoring is not yet justified.
Metric-based evaluation is the post-deployment mode. The dataset gets large, usually seeded from real production executions, expected outputs become effectively required, and a metric becomes necessary because nobody can eyeball three hundred rows. n8n notes that performance gains per iteration are large in the light phase and small in the metric phase, which is the honest way to describe it. Metrics are not how you make a workflow good. They are how you stop a good workflow from getting worse.
Build with light evaluation, deploy, then convert the same setup into a metric-based one by adding Set Metrics nodes. You do not start over.
The five built-in metrics, and when each is right
n8n's Set Metrics operation ships five metrics, and each answers a different question. Correctness is AI-based and scores from 1 to 5 whether the answer's meaning matches a reference answer. Helpfulness is also AI-based on the same 1 to 5 scale and asks whether the response actually answers the query. String Similarity measures character-by-character edit distance and returns a score between 0 and 1. Categorization returns 1 for an exact match with the reference answer and 0 otherwise. Tools Used returns a score between 0 and 1 for whether the execution used tools.
Choosing badly here is the most common mistake. Categorization is right for a ticket router, a lead-scoring step, or anything with a fixed set of allowed answers, because exact match is what you actually care about. String Similarity suits extraction tasks where the output should mirror a known value, such as pulling an invoice number. Correctness and Helpfulness are for open-ended text where meaning matters more than characters, and they cost real tokens on every row because a model does the grading.
Tools Used is the one people forget, and it is the metric that catches agent regressions. An agent that answers plausibly without ever calling the CRM lookup is worse than one that fails loudly.
You can also record custom metrics. Calculate any number inside the workflow, map it into a Set Metrics node with Custom Metrics selected, and name it yourself. Metric values must be numeric, which is a hard constraint worth designing around: a pass or fail becomes 1 or 0.
n8n's own production AI playbook suggests a sensible baseline for every workflow regardless of type, tracking execution time, token count and error rate, then adding task-specific metrics on top. It also warns that over-measuring upfront creates noise without insight, which matches what we see in client projects.
Which plan tier you actually need
Light evaluations are available on all n8n Cloud plans, and on self-hosted registered Community, Business and Enterprise. Metric-based evaluation is narrower: n8n Cloud Pro and Enterprise, and self-hosted Enterprise. n8n does add that registered Community and Starter plan users can use metric-based evaluation for a single workflow, which is enough to prove the approach before anyone signs a contract.
Concurrency is tiered too. On self-hosted Community and n8n Cloud Pro the maximum is one test case at a time, so runs are sequential and the Run Test button has no concurrency control at all. Self-hosted Business allows three parallel test cases, and n8n Cloud Enterprise and self-hosted Enterprise allow five. Self-hosted instances can override the maximum with the `N8N_CONCURRENCY_EVALUATION_LIMIT` environment variable regardless of plan tier. n8n warns that raising concurrency increases the chance of hitting upstream model rate limits, so if you start seeing rate-limit errors, lower it before you blame the workflow.
Where the test dataset should live
The Evaluation Trigger takes its dataset from either a data table or Google Sheets, and data table is the default source.
Data tables are n8n's native structured storage, scoped to a project, creatable from scratch or by importing a CSV, and downloadable as CSV. For evaluation datasets they are usually the right choice: no external credential, no sharing question, and the data sits beside the workflow it tests.
There are real limits to respect. By default the total storage used by all data tables in an instance is capped at 200 MiB, adjustable on self-hosted with `N8N_DATA_TABLES_MAX_SIZE_BYTES`. n8n warns at eighty percent and again at the limit, and exceeding it disables manual additions and causes execution errors on insert or update. Data tables are also not readable from a Code node, so transformation has to happen through the Data Table node.
Choose Google Sheets instead when non-technical reviewers need to label rows. A support lead adding expected outputs to a shared sheet is worth the extra credential.
On the trigger itself, Limit Rows is off by default, and when you switch it on the default Max Rows to Process is ten. There is also a row filter that restricts the run to rows matching a column value, which is how you slice a large dataset down to one category while debugging.
A rollout that works
Start with ten to fifteen hand-written cases covering your core categories plus the edge cases you already know about. For anything already live, n8n's playbook makes a better suggestion: seed the dataset from real inputs in your execution history rather than inventing test cases.
Then let the dataset grow from failures. Every time production produces a wrong answer, add that input as a row with the correct expected output. Over time this becomes a regression suite encoding every mistake the system has ever made. Anthropic's guidance on eval design points the same way, favouring a larger set of automatically graded cases over a small hand-graded one, because automation is what makes the suite runnable often enough to matter.
Set a cadence and hold it. High-volume workflows deserve a daily run, lower-volume ones weekly, and every prompt or model change should trigger a run before it reaches production. This is the discipline we build into client projects at AbhijeetBuilts: an AI workflow does not go live without a dataset and a metric attached to it, because the alternative is discovering the regression from a customer.
Traps that waste the first week
Four gotchas are documented, and all four are cheaper to read about than to discover.
You can only have one evaluation trigger per workflow. To test different parts separately, break them into sub-workflows and evaluate each one, which is a good argument for smaller workflows anyway.
Adding a Set Outputs node can break the built-in chat, because n8n's chat reads the output of the last executed node. The fix is an extra branch off the agent into a no-op node, since lower branches execute later and that no-op then runs last.
Metric noise is real. The same workflow scored twice can produce different numbers, because both the workflow and any AI-based metric vary. n8n's remedy is to duplicate rows in the dataset so each input runs more than once and the variation smooths out.
If a metric needs to know whether the agent called a tool, you cannot reference sub-nodes with expressions. Enable Return Intermediate Steps on the agent, which adds an `intermediateSteps` field you can read downstream.
Pair evaluations with production monitoring
Evaluations tell you whether output quality is holding. They say nothing about volume, failures or run time, and you need both views.
n8n Insights covers the operational half. The summary banner showing the last seven days is available on all Cloud plans and all self-hosted editions, and it reports total production executions, failed production executions, failure rate, time saved and average run time. The fuller Insights dashboard, with per-workflow breakdowns and longer historical ranges, requires Cloud Pro or Enterprise, or self-hosted Business or Enterprise.
Read them together. A stable failure rate with a falling correctness score is silent quality drift, the failure mode that costs the most before anyone notices.
Where to start this week
Pick the one AI workflow whose output someone would complain about if it were wrong. Pull fifteen real inputs from its execution history into a data table, add expected outputs, wire in an Evaluation Trigger and a Set Outputs node, and run it. That is an afternoon, and it will tell you something uncomfortable and useful.
If you are running AI agents, classification steps or document processing inside n8n and have no idea whether quality is holding, this is the gap worth closing first. We design, build and instrument these pipelines for clients at AbhijeetBuilts, including the evaluation layer that keeps them honest after launch. Get in touch through the site and we can look at what you are running and what it would take to make it measurable.
Related resources
Keep building the automation map
Move from the guide into the services and proof pages connected to this topic.
Related services
Service
Explore n8n Workflow Development
Custom n8n workflow automation for lead capture, CRM sync, AI enrichment, approvals, and notifications — built to keep running when nobody is watching.
Service
Explore AI Agent Development
AI agents for sales replies, lead memory, storyboard generation, data extraction, and structured automation outputs.
Service
Explore AI Operating System
A done-for-you AI operating system built on Claude: a second brain that knows your business, remembers everything between sessions, and safely runs your recurring work.
Further reading
Guide
Read: n8n Error Handling in 2026: Stop Silent Workflow Failures
n8n error handling in 2026: how to layer node retries, error workflows, Stop and Error checks, and monitoring so workflows never fail silently.
Guide
Read: RAG for Business Knowledge Bases: What Works in 2026
RAG for business knowledge bases fails on retrieval, not the model. A 2026 build guide to chunking, reranking, permissions and measuring what works.
Guide
Read: Human-in-the-Loop AI Agents: The 2026 Approval Framework
Human-in-the-loop AI agents don't need approval on every action. Here's the four-tier risk framework that keeps AI agent oversight tight in 2026.
Proof pages
Case study
See case study: Multilingual WhatsApp Sales Bot for an International Freight Forwarder
A WhatsApp AI sales assistant that qualifies freight enquiries in three languages, remembers every conversation, and alerts the sales team the moment a quote is requested.
Case study
See case study: Automated LinkedIn Outreach with AI Reply Agent
A complete LinkedIn outreach system: prospect scraping, a deliberately gradual connection ramp, post engagement, acceptance tracking, campaign messaging, and Claude-powered replies that remember every lead.